With our expertise in data analysis, artificial intelligence, and IT, we turn your challenges into opportunities—and your data into winning strategies.
We support SMEs—whether they’re just starting out, scaling up, or already established—to optimize operations, refine marketing efforts, and anticipate market trends.
Adopt our agile and tailored approach to uncover hidden opportunities and boost your competitiveness in the data-driven era!
Data Detective


Assess Your Data Maturity
Your Strategic Data Partner for Success
We help businesses harness their data to make strategic, impactful decisions—powered by our expertise in data science and artificial intelligence.


Turning Data into Impact Through Expertise
Happy Client
"
About Me
I’m a Data Scientist and Biostatistician with over 8 years of experience in managing research projects and analyzing complex data.
My background in biostatistics taught me solid methodological rigor, further strengthened by international collaborations (GIZ, Swiss Cooperation, UNESCO).
I’ve since expanded my expertise to include machine learning and natural language processing, tackling challenges across diverse sectors—from agriculture to social economy, healthcare, and renewable energy.
Combining deep technical knowledge with large-scale project management, I turn your data into actionable insights to boost your competitiveness.
Now working as a freelancer, I’m here to help you turn your challenges into opportunities.
Ready to bring your ideas to life through data?
Book a meeting today to talk about your project.
Take Control of Your Data Maturity: Evaluate and Elevate Your Strategy
The Benefits of a Data-Driven Strategy for SMEs
Just as some artisans still jot down orders in notebooks or restaurant owners rely on Excel files to track sales, many small and medium-sized businesses still manage their operations intuitively. Yet in a rapidly changing world, embracing a data-driven strategy turns these habits into real competitive advantages.
By leveraging advanced analytics technologies, your data—from transactions, customer feedback, and social media interactions—becomes a powerful strategic asset.
The benefits are numerous:
• Informed decision-making: Adjust your strategies quickly with accurate insights.
• Resource optimization: Spot inefficiencies and reallocate investments effectively.
• Personalized marketing: Target the right customers with precision.
• Agility: Respond to market shifts in real time.
Whether you’re just starting out, scaling up, or already established, adopting a data-driven approach transforms your daily challenges into concrete opportunities.
Revealing the True State of Your Data Maturity
What Is Data Maturity?
Data maturity refers to how well a company integrates and leverages data in its operations. Think of it like an athlete’s fitness: at first, the business collects a few numbers here and there (basic level), then it trains to better analyze its performance—until it becomes a high-performing team that uses data to innovate and anticipate market changes.
How to Choose the Right Data Maturity Model
Many data maturity assessment models exist—some internationally recognized, others developed in-house—but none can capture all the unique aspects of your business. Choosing the right model for your situation is essential to boosting your competitiveness.
Key criteria to consider:
Company characteristics (size, industry, assessment dimensions)
Digital initiatives and level of commitment
Internal capabilities and technological infrastructure
Strategic objectives (growth, innovation, cost optimization)
For an accurate and relevant evaluation, consult an expert.
Check out our blog for expert insights and recommended models.
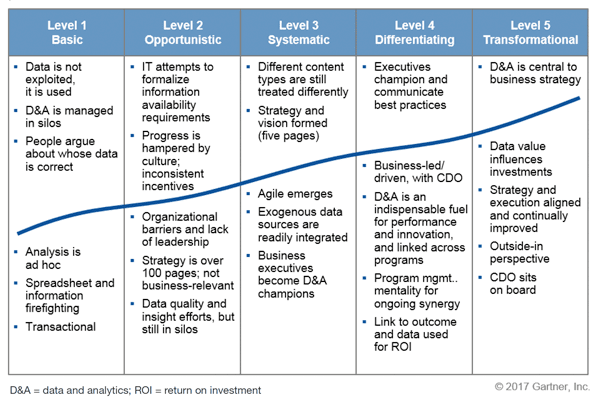
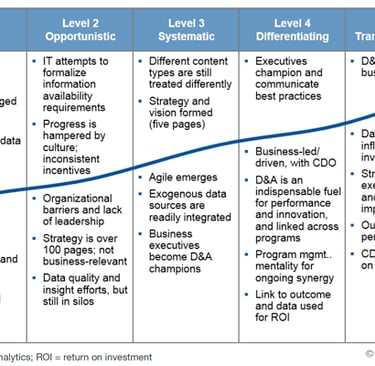
Recognized for its clarity and reliability, the Gartner model defines five levels of data maturity—Basic, Opportunistic, Systematic, Differentiating, and Transformational—to guide businesses in their data-driven journey.
Tailored for SMEs, this structured approach empowers you to assess your current state, identify growth levers, and build a competitive edge through data.
During our consultation, we’ll identify the most relevant model to maximize your data’s impact and accelerate your growth.
Why Assess Your Data Maturity?
Assessing your data maturity means conducting a full diagnosis of how your business uses data. It allows you to:
Identify strengths and weaknesses: Like a health check-up, it highlights areas for improvement—such as outdated tools or lack of training.
Uncover improvement opportunities: Pinpoint where to invest to streamline and enhance your operations.
Plan your digital transformation: Build a clear roadmap to shift towards a data-driven approach.
Put Your Data to Work
Tailored solutions for optimal strategic decisions and measurable impact.


Data Assessment
In-depth analysis to optimize your decision-making processes and enhance performance.
AI-Powered Models
Implementing innovative solutions to turn your data into strategic assets.
Personalized Support
Specialized Data Science Support for Growing Businesses and Financial Players.
Data project
Exploitez vos données pour des décisions stratégiques optimales.


Data Assessment
In-depth analysis to optimize your decision-making processes and enhance performance.


AI-Powered Models
Tailored Solutions for Your Business and Industry


AI Education & Skills Development
Educational support to master analytical tools.
Innovative Strategies
Create bold, data-driven approaches for lasting results